The Colors In the CTS Reports Show The Ranges of Compatibility For Specific Sales Positions
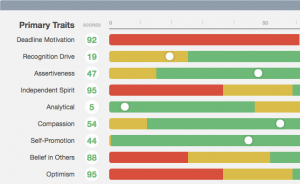 The candidate’s score is shown as a circle with a white center and green numerals.
Green bars on each scale represent the statistically-derived ideal score range on that trait for the particular sales position. Its relative length shows its predictable strength. For example, the shorter length of a trait’s green bar means it contributes the most to predicting success for that sales position.
If the candidate’s score is outside of the ideal range, you will see the circle plotted within the red or yellow area. Red signifies a score significantly outside of statistical ideal, while the yellow indicates a moderate, but not ideal, score.
Each of the nine traits measured, Deadline Motivation, Independent Spirit, Analytical, Compassion, Assertiveness, Self-Promotion, Recognition, Belief in Others and Optimism will have a circle positioned indicating the participant’s score.
As you glance at the chart, you can quickly see which traits score furthest away from compatibility with the statistical norm for high sales performers.